
Grasshopper / Field notes
Build AI-Ready Grasshopper Dashboards with Ontologic Studio
Turn Grasshopper controls, geometry and live charts into a local design tool.
A Grasshopper definition can contain a useful design tool long before it becomes easy for someone else to use. The controls are there, the geometry updates and the data is available, but operating it still means finding your way around the canvas. I built Ontologic Studio to bring those pieces together: a local interface where you can change parameters, inspect the model and see the results from the same definition.
Bring the design question into one view
In a design discussion, changing a parameter is only half the task. You also need to understand its consequences. What happens to the building when you add storeys? How does the floor area change? Which part of the model accounts for a particular result? Keeping the controls and the feedback close together makes those questions easier to explore.
The opening example brings a tower model, live controls, charts and a floor register into one workspace. Grasshopper still holds the relationships behind the model. Studio provides an interface for operating that definition without asking the person using it to navigate all its components and wires. The tool remains local to Rhino and Grasshopper.
Start with the controls you already have
You can begin with an existing definition. Add a Studio Panel for a dockable interface in Rhino, or a Window for a separate dashboard. Then publish the controls you want to expose through their Grasshopper context menus.
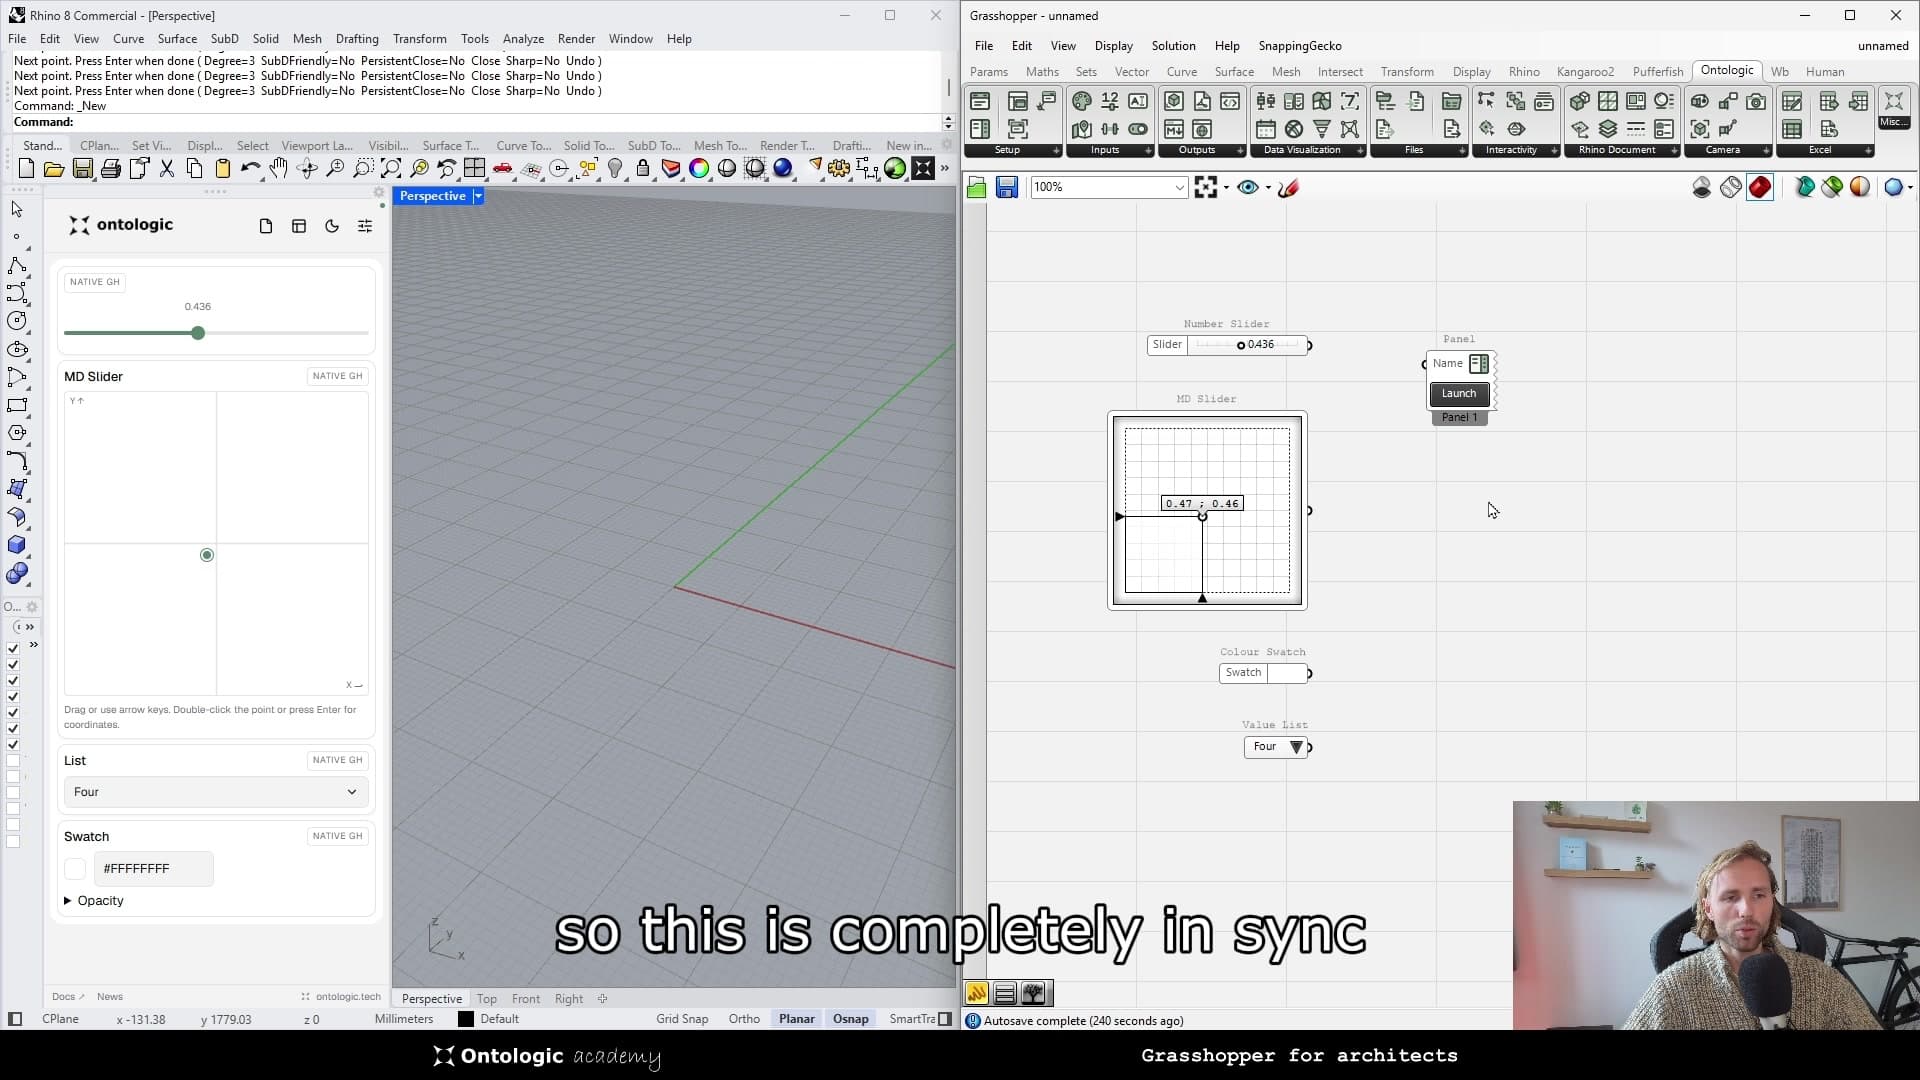
At 2:59 in the walkthrough, the Rhino panel shows the same numeric slider, MD Slider, value list and colour swatch as the Grasshopper canvas. Their values stay in sync. This gives you a starting point without rebuilding every input using a separate interface system.
Groups help turn that collection of controls into something readable. In the walkthrough, grouped components become expandable sections. Give the inputs names that describe the design decisions they control, so the interface makes sense to the person using it.
Connect the results and organise the layout
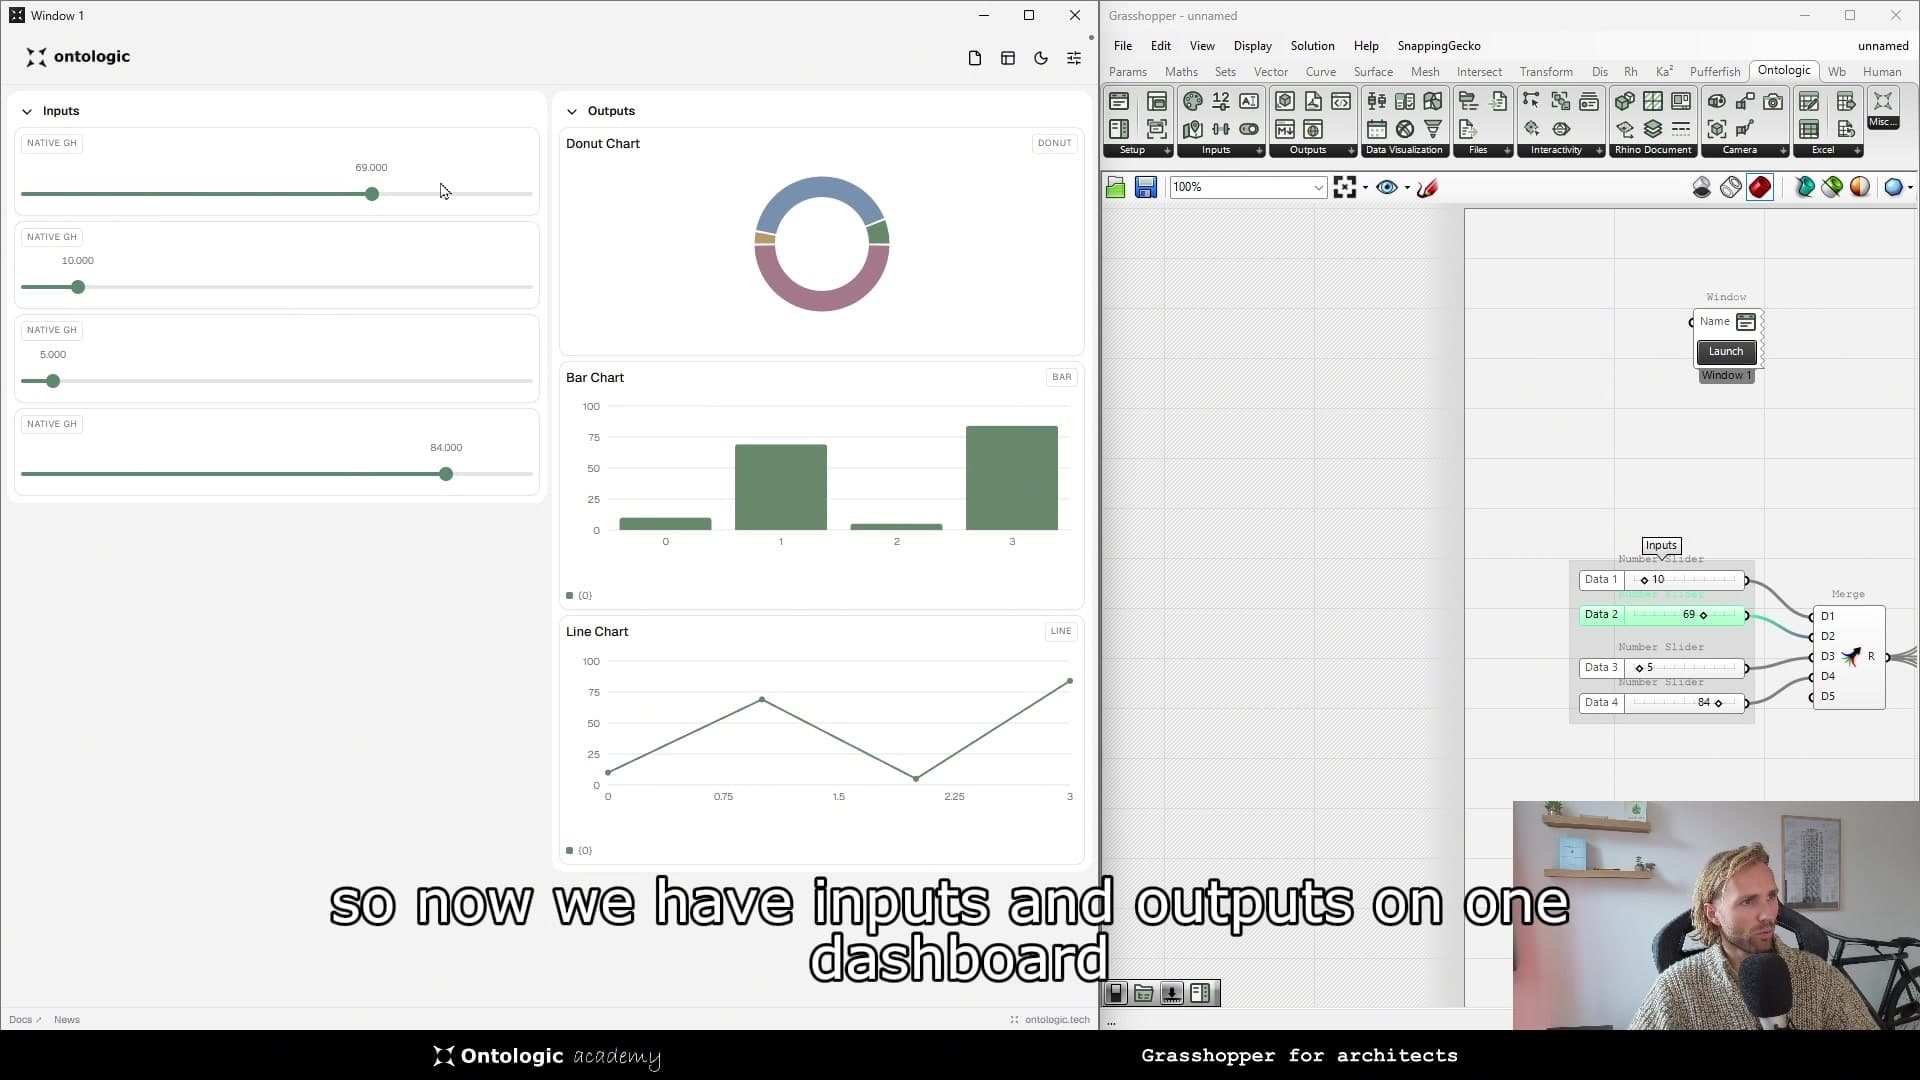
Next, connect Grasshopper data to Studio chart components and publish those alongside the inputs. The walkthrough starts with donut, bar and line charts. Changing a slider updates the data that feeds them, so the interface shows the effect of a change alongside the control that caused it.
At 5:24, the inputs and outputs are arranged into two columns. The example uses a small set of numeric values to show how the charts update. In your own tool, connect those charts to the results of the design logic you want to inspect.
Choose each chart around a question. A bar chart can make differences between buildings easy to compare; a donut chart can show how a total is distributed. A useful dashboard makes the result easier to interpret, rather than simply displaying every available value.
Let the data determine how many controls you need
One limitation I wanted to address was the need to create sliders individually. Studio's Number Input can create multiple controls from the labels supplied to it. In the video, a character sequence and a formatted label generate Slider A, Slider B, Slider C and so on.
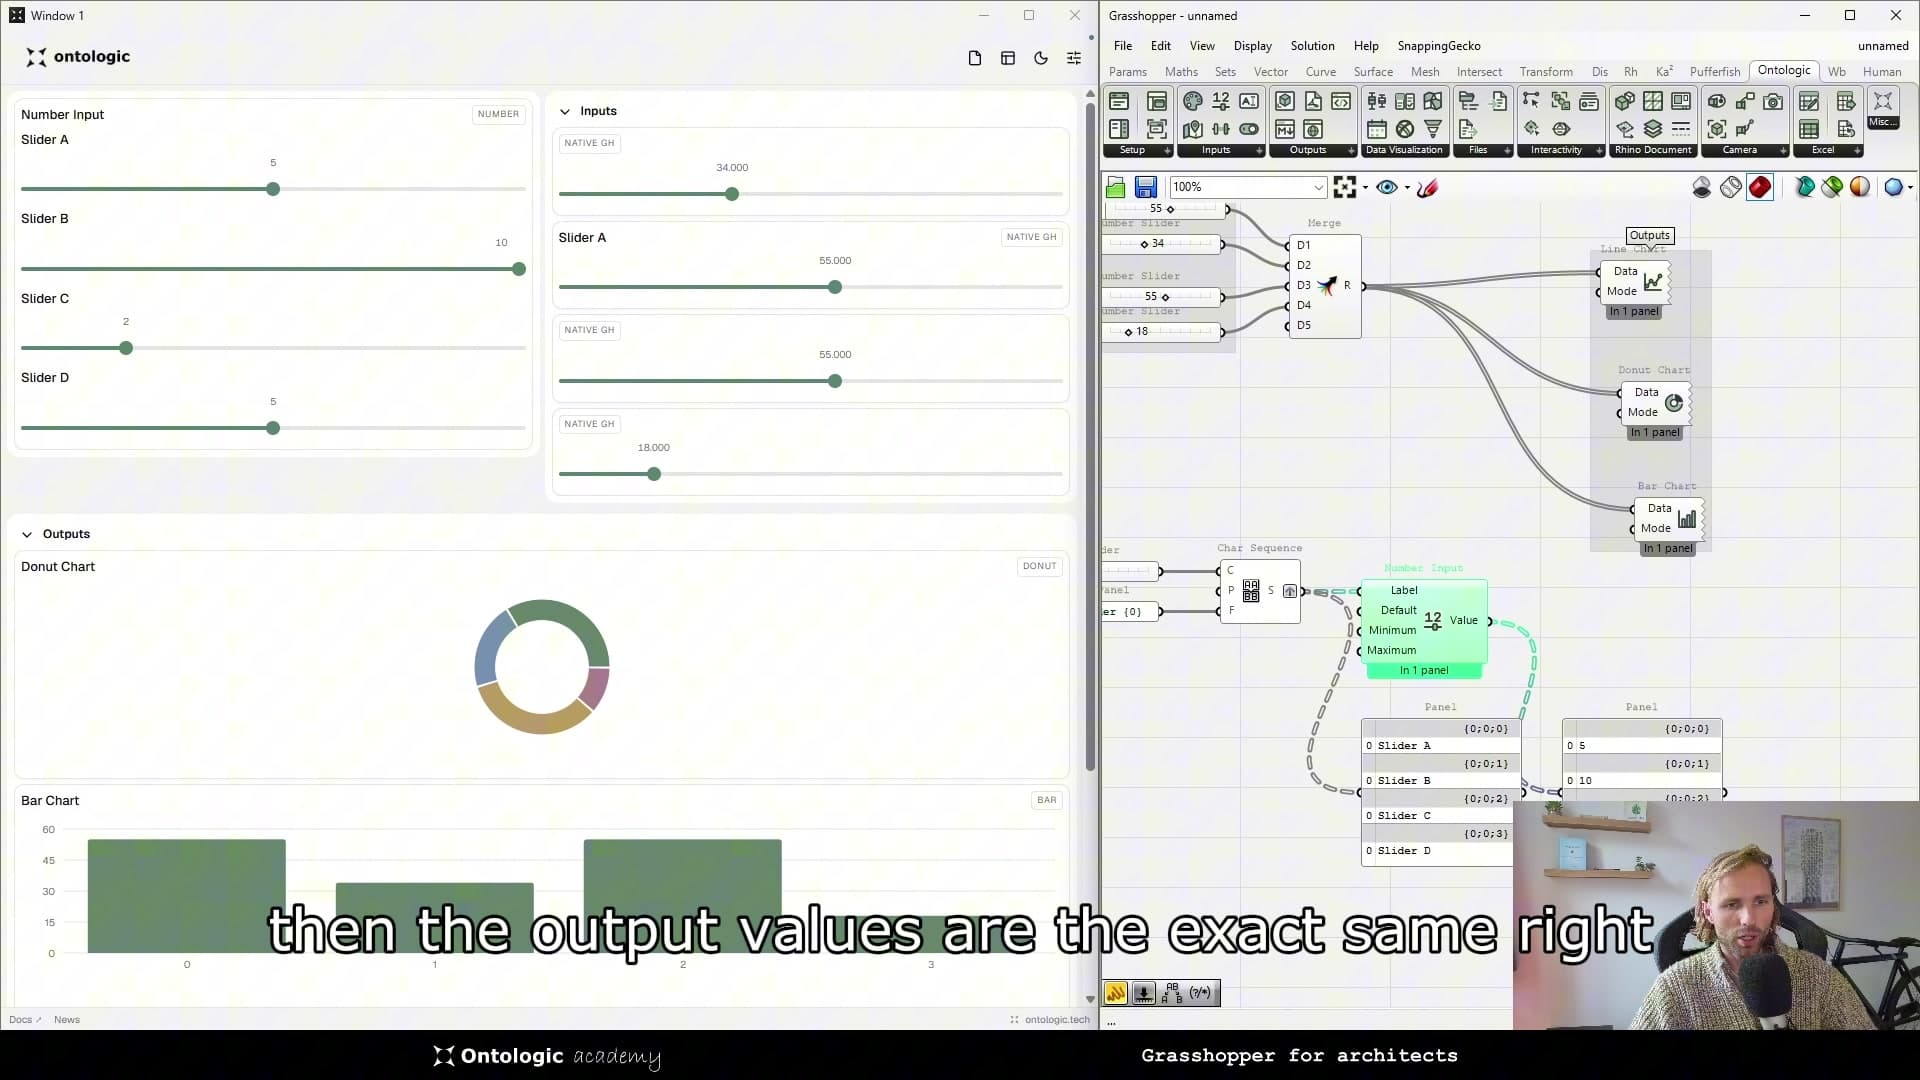
At 7:20, the label tree and the returned values use matching branches. That matters when the definition already organises information into a data tree: the interface can follow that organisation instead of introducing a separate collection of manually maintained controls.
The building example shows why this is useful. As the Grasshopper workflow creates buildings, each can receive its own controls. The definition supplies the relationship between an object, its label and its parameters.
Use chart interactions as inputs to the model
Charts can also return interaction data. At 13:56, selecting a segment in the floor-area chart highlights the corresponding building in Rhino. The dashboard connects a reported quantity back to the geometry it describes.
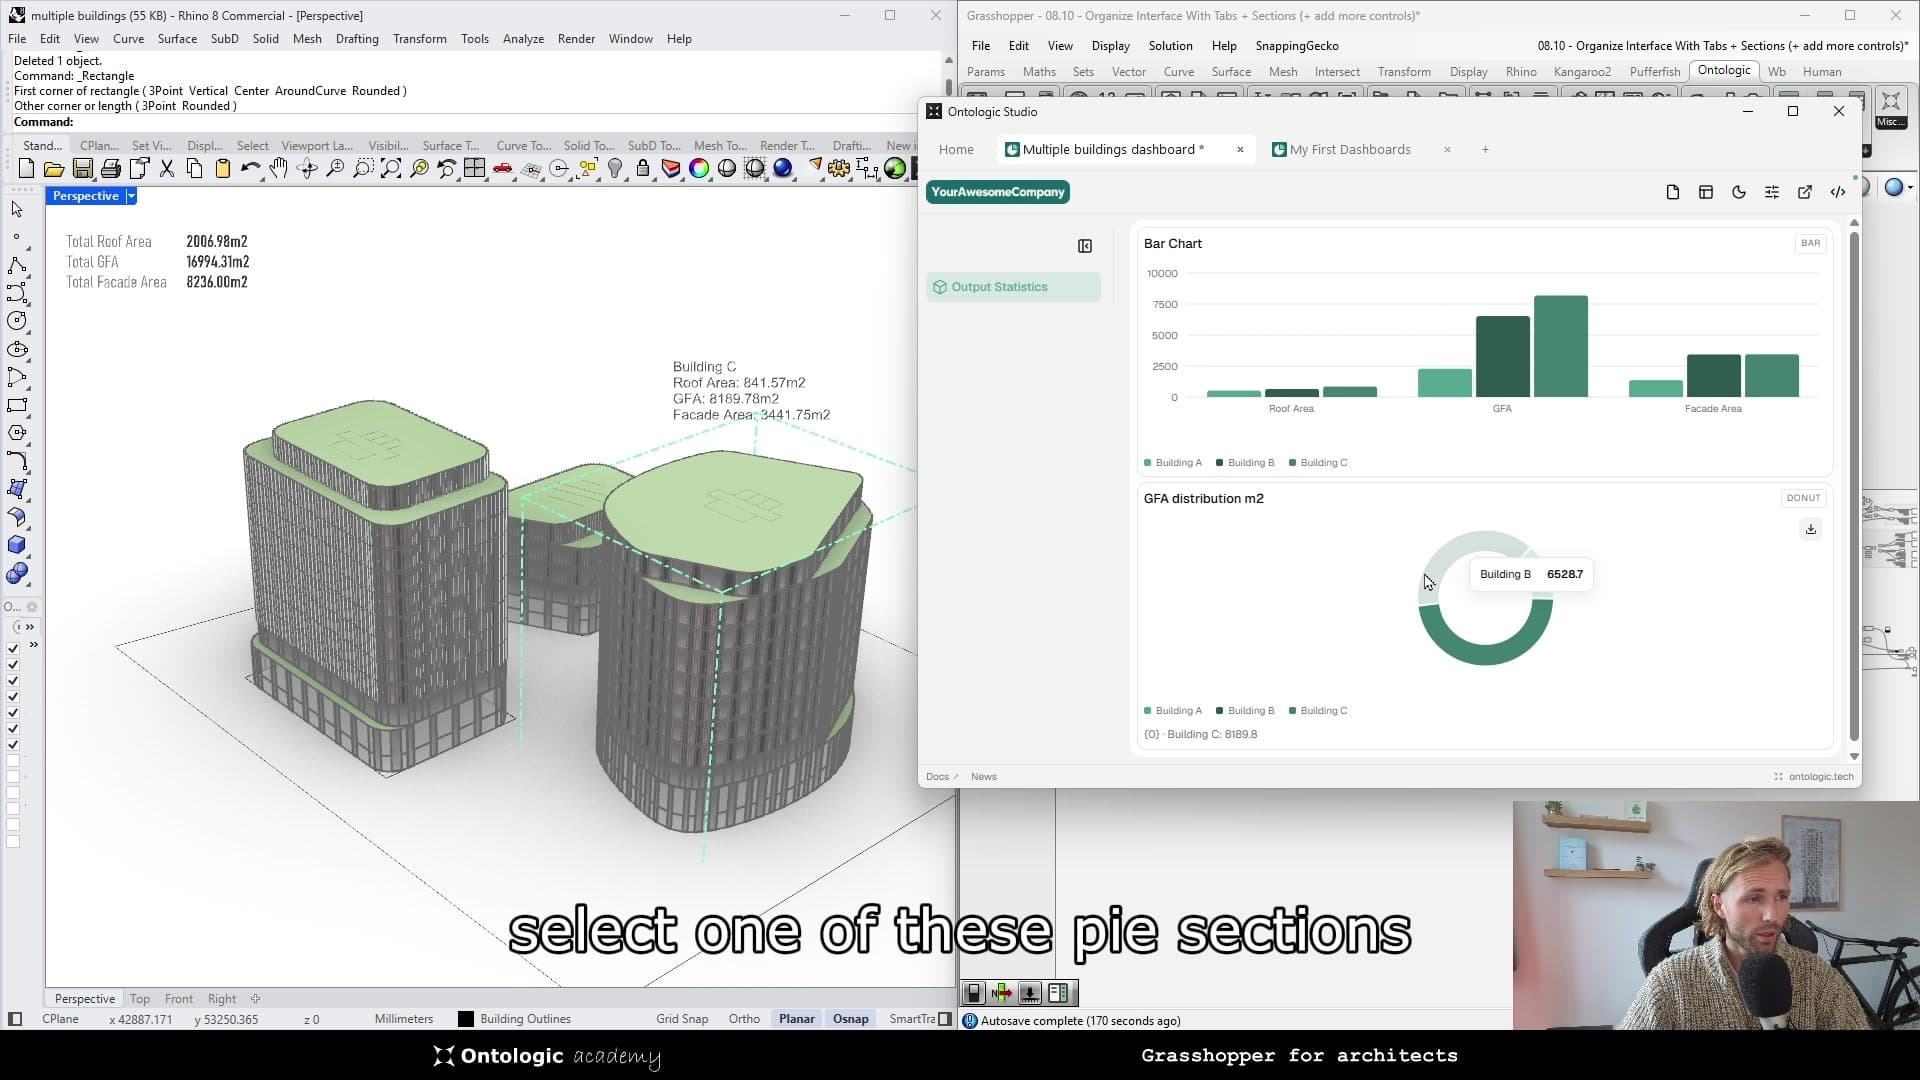
This connection makes the dashboard useful for investigation as well as presentation. You can start from a result and identify the part of the model behind it. The building example combines this with controls for storey heights, facade patterns and louvre options, while charts compare roof area, gross floor area and facade area.
More detailed chart options are available through secondary inputs and outputs. The walkthrough also covers multiple data series, animation settings and colour inputs. Expose the settings you need, then hide unused secondary inputs to keep the canvas manageable.
Give the tool a clear identity and save it
At 9:26, the styling panel shows colour presets and appearance controls above the dashboard preview. Studio includes light and dark modes, palette generation and settings for spacing, corners and text size. The walkthrough then adds a tool name, header logo and icon.
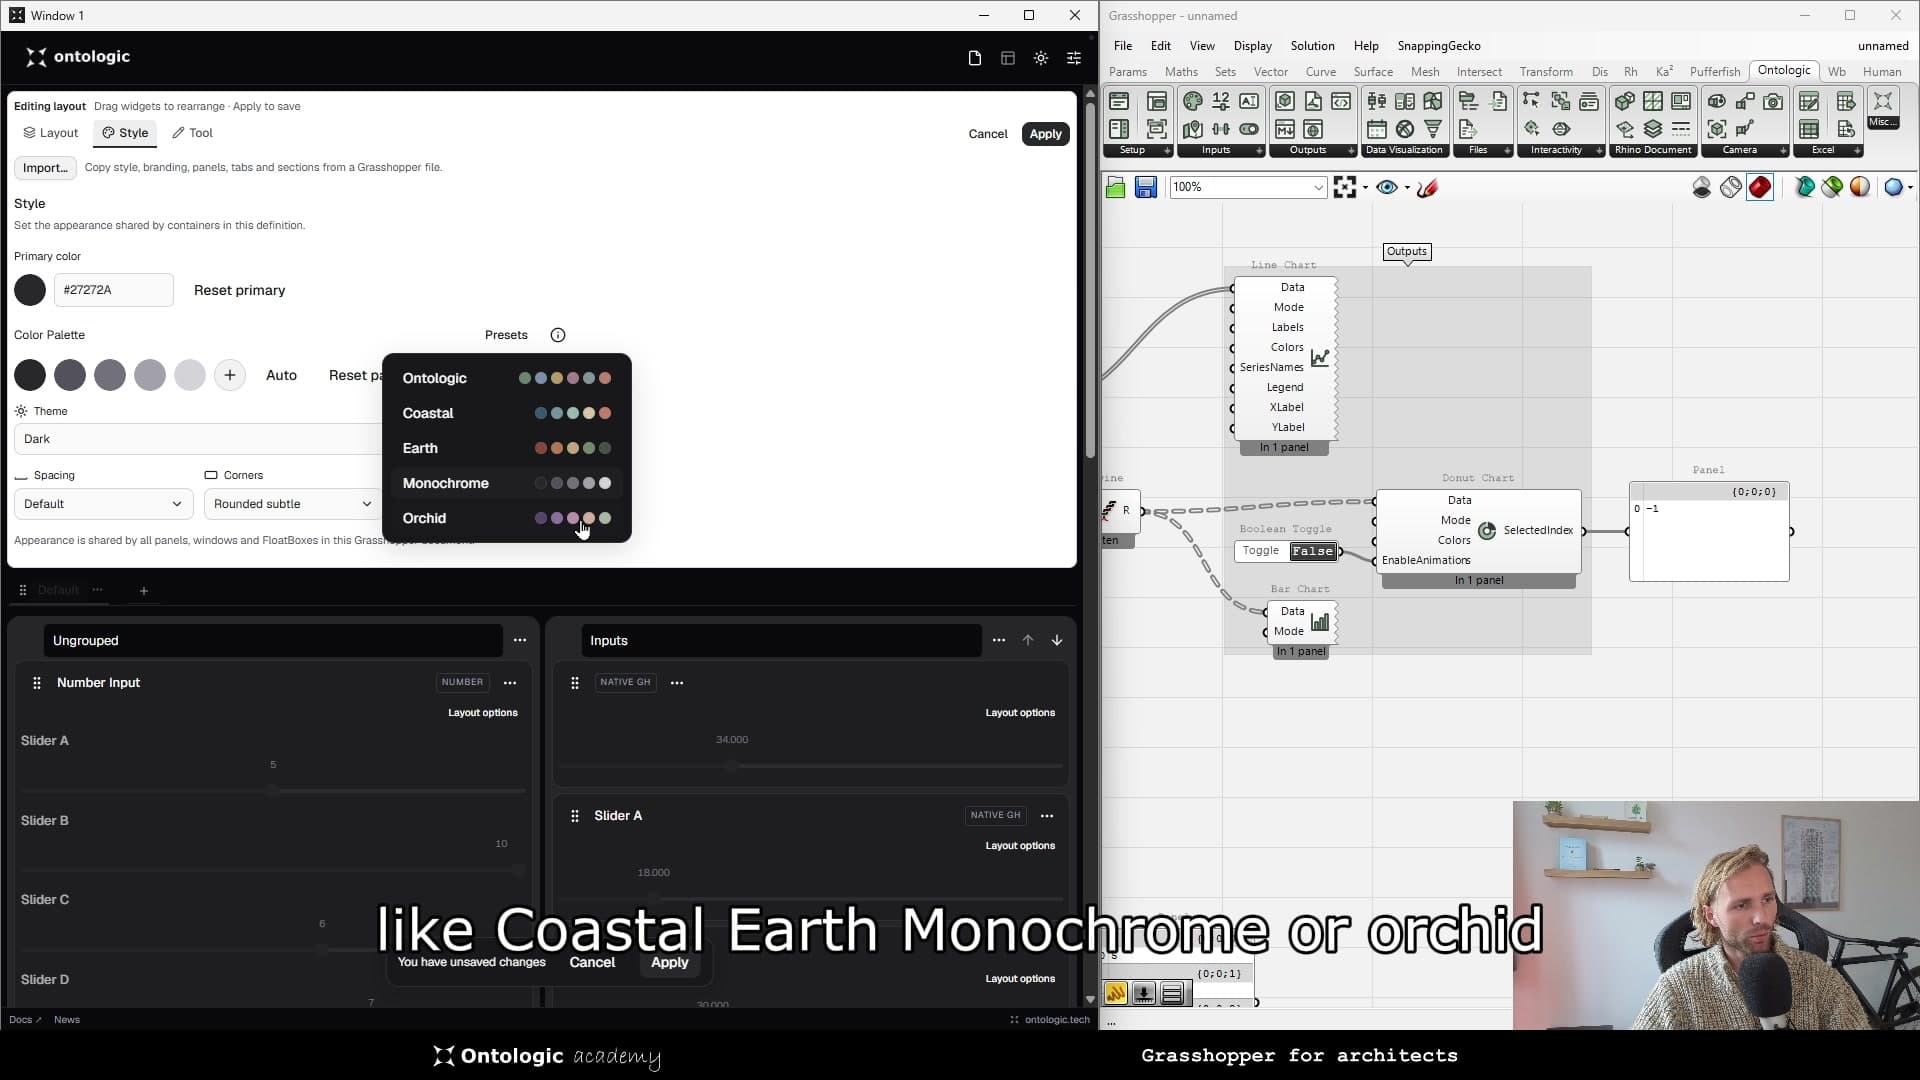
The walkthrough shows a window and panel connected to the same definition, plus tabs for separating different parts of a tool. After applying the settings, save the Grasshopper file. You can include a saved tool in the Studio start screen and open multiple definitions in the same environment.
Start with a small interface: a few meaningful controls and the outputs needed to evaluate them. Once those connections are clear, add tabs or additional panels where they help the workflow.
Where AI fits into the workflow
I designed Ontologic Studio to be legible to AI, so AI assistance can help create dashboards around a structured Grasshopper definition. Clear labels, meaningful controls and organised outputs make that workflow easier to describe and inspect.
This walkthrough focuses on building and using the dashboards. The architectural logic remains in Grasshopper: the interface exposes the decisions you choose and presents the results needed to evaluate them.
Try Ontologic Studio with your own definition
Ontologic Studio is a free plugin, and the version demonstrated here is a beta. In Rhino Package Manager, enable prerelease packages, search for OntologicStudio, install it and restart Rhino. Check the current Studio documentation for the supported Rhino version and runtime requirements before installing.
The building workflow in the video is also an example from Grasshopper for Architects — Thinking in Data. If you want to build the logic behind tools like this, the course explores how data and structure connect to architectural geometry. Studio gives you a way to put an interface around that logic.
Try exposing a small part of one of your own scripts. Pick the controls someone needs to operate it, add feedback that explains the result and see whether they can explore the model without your guidance. I would be interested to hear what you build and where the beta can improve.
Explore the current component reference at https://www.ontologic.tech/plugins/mini-studio and the Grasshopper for Architects course at https://www.ontologic.tech/courses.
From concept to canvas
See the workflow in practice
The companion video shows the model and the workflow behind these ideas. Watch the walkthrough when you want to see how the pieces connect.
Watch on YouTube